Every donor tells a story through their giving habits. As a nonprofit fundraiser, your ability to read these stories can significantly impact your organization’s success. Identifying donor patterns and trends isn’t just about crunching numbers—it’s about understanding the heartbeat of your donor base and anticipating their interests.
Moreover, understanding donor patterns helps ensure your fundraising strategies are inclusive and ethical, reaching and resonating with donors across diverse communities and demographics.
In this guide, we’ll explore how to uncover and interpret these valuable donor stories, helping you transform raw data into actionable fundraising strategies that drive results.
The power of donor pattern recognition
Recognizing donor patterns allows you to predict future giving behavior, tailor your communication strategies, identify potential major donors, and improve donor retention rates. For example, identifying lapsed donors—supporters who haven’t given in over a year—can highlight opportunities for re-engagement campaigns.
Understanding these patterns transforms your approach from reactive to proactive strategies, enabling you to cultivate stronger, more meaningful relationships with your supporters.
Key donor patterns to watch
When analyzing donor behavior, pay attention to:
Giving frequency
- Monthly vs. annual donors
- Seasonal giving patterns, such as year-end giving
- Response time to appeals
Donation amounts
- Average gift size
- Year-over-year changes
- Upgrade potential
Preferred giving channels
- Online donations
- Mail-in checks
- Event participation
Response to specific campaigns
- Campaign type preferences
- Message resonance
- Timing effectiveness
Engagement with non-financial activities
- Volunteer participation
- Inviting friends and family to support your cause
- Social media and website interaction
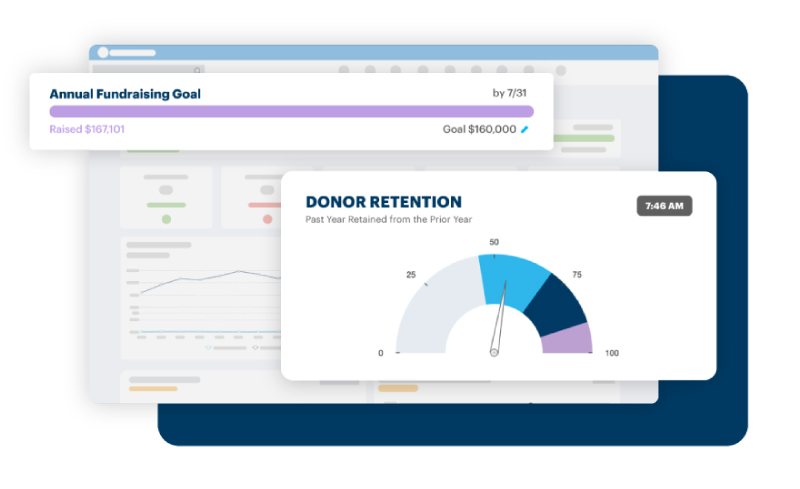
DonorPerfect’s reporting features allow you to easily visualize these key patterns, helping you spot trends at a glance and make data-driven decisions based on donor analytics.

Leveraging technology for trend analysis
Modern CRM systems have revolutionized trend analysis for nonprofits. These tools compile vast amounts of donor data, making it easier to spot patterns that might otherwise go unnoticed. Look for trends in:
- Donor retention
- Demographic shifts in your donor base
- The impact of external events on donations
- Changes in average gift size over time
Pro tip: Schedule monthly data review sessions with your team. Consistent analysis helps you catch emerging trends early and adapt your strategies accordingly.
From patterns to action
Once you’ve identified key patterns and trends, it’s time to put that knowledge into action so your team can boost donations. Use your insights to segment your donor base for targeted communications and personalize your fundraising appeals. You can also optimize the timing of your campaigns as well as identify and nurture potential major donors. Remember, the goal isn’t just to collect data, but to use it to build stronger connections with all donors regardless of their giving level.
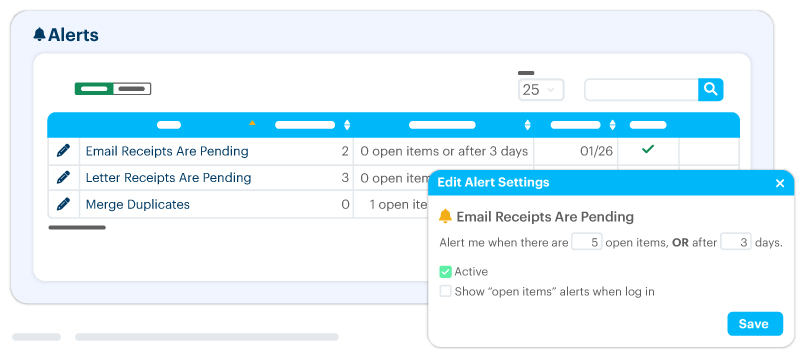
DonorPerfect’s alert system can notify you of significant changes in donor behavior, ensuring you never miss an opportunity to engage with a supporter at the right moment.

The role of prospect research
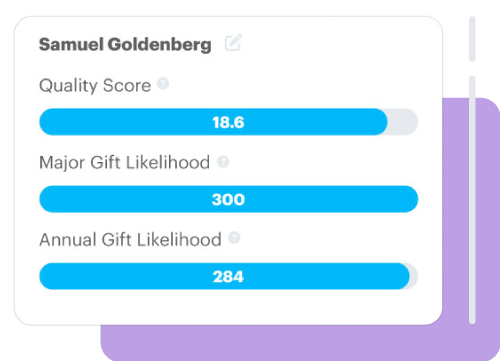
Prospect research plays a crucial role in identifying donor patterns and trends. By examining factors such as giving history, wealth indicators, and philanthropic interests, you can uncover valuable insights about your donors’ capacity and inclination to give.
Key research benefits
- Identify potential major donors within your existing base
- Tailor your ask amounts appropriately based on research findings
- Align your projects and communications with donors’ interests
Best practices for data privacy
- Implement secure data management steps
- Follow data protection regulations
- Be transparent about data usage
- Respect donor preferences
Ready to reveal donor insights hiding in your database? DonorPerfect integrates with DonorSearch to provide comprehensive prospect research tools that help you identify your most promising donors and strengthen your fundraising strategies.

Identifying donor patterns and trends is a powerful tool in your fundraising toolkit. By harnessing the power of data analysis and modern CRM technology, you can gain deep insights into your donors’ behavior, preferences, and engagement potential. This knowledge empowers you to create more targeted, effective fundraising strategies that resonate with your supporters and drive your mission forward. With DonorPerfect, discover analytical tools to help you identify patterns, predict giving behavior, and strengthen donor relationships.
Frequently Asked Questions
1. How often should we analyze donor patterns and trends?
2. What’s the best way to start identifying donor patterns if we’re new to this process?
3. How can we use donor pattern analysis to improve donor retention?
See how DonorPerfect helps nonprofits grow
Request your free demo today!


