


Reporting and Data Analytics
KNOW YOUR METRICS TO GROW YOUR MISSION

Click Image to Enlarge
With DonorPerfect reporting tools, you’ll always have the insights you need to make data-informed fundraising decisions. Built-in reports like AFP Key Donor Metrics and quick-access dashboards make it easy to monitor campaign performance and dollars raised. Easy Report Builder gives you the flexibility to create custom reports that align with your goals, while SmartAnalytics delivers the deepest analysis, transforming data into clear visualizations with ready-to-use templates or visuals you design yourself.
Compare DonorPerfect reporting tools
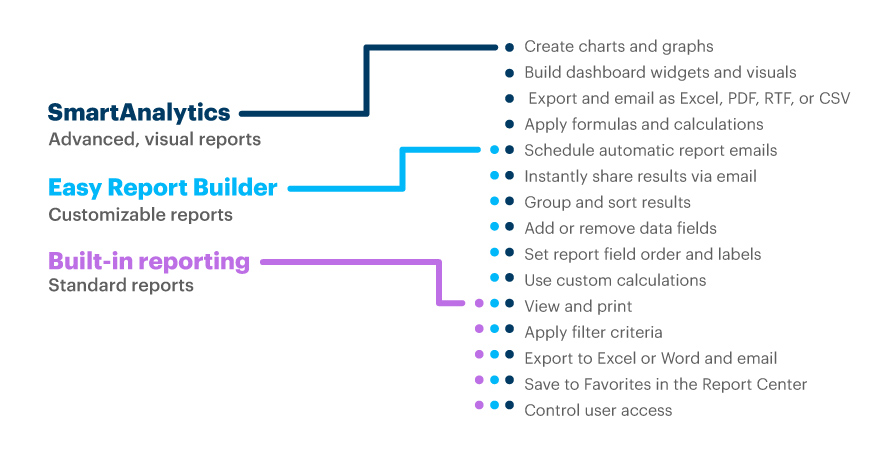
Reporting and data analytics benefits and features
Track progress with dashboards
- Quickly access real-time stats and graphs
- Toggle between organizational and personal dashboards
- Edit your dashboard layout</li.
- Pin your most-used reports to your dashboard
See trends with built-in reports
- Choose from 70+ standard nonprofit reports
- Build unlimited custom filters
- Apply filters and settings from the report sidebar
- Export to Excel, Word, or PDF
Create custom reports with Easy Report Builder
- Group, sort, sum, average, and count data
- Schedule reports to be emailed in intervals to anyone
- Password-protect your emailed reports
- Export to Excel, Word, CSV, or PD
Visualize your data with SmartAnalytics
- Highlight key metrics in dynamic charts, graphs, and gauges
- Schedule and auto-send reports to keep stakeholders informed
- Turn complex data into clear insights that guide decisions
- Export to Excel, PDF, RTF, or CSV
The scheduled reports helped our president, our biggest fundraiser, to solicit more funds. Because of these reports and the dashboard that we created for him, he could really focus his time and effort on soliciting the most ideal donors.”
